While re-leveling the bed for the hundredth time I noticed a major bend in the aluminum plate. It did not exist when the machine was "new" but likely developed over hundreds of heating and cooling cycles. Measuring exposed 0.47mm variation, equivalent to 2~3 layers!
Using R to analyze of my 3D printer's imperfect bed gave me several important benefits
Using R to analyze of my 3D printer's imperfect bed gave me several important benefits
- infinitely flexible in how I parse and arrange the data
- totally eliminates tedious by-hand manipulation (looking at you Excel)
- the same script can be used on many data sources because fixing the plate was an iterative process
- a community of published libraries to build everything faster
I experienced an increasing rate of failed prints peaking at 2 out of every 3 prints not adhering to the build plate. I needed to know why. I needed more data to evaluate which route to take, so I added a touch probe to measure in-situ.
The first data was taken from a tool within the Repetier Host software but immediately I knew that would not give me any actionable information. I am interested in how planar the bed is, and separately how normal that plane is to the printer axes. This heat map shows the sum result of these two errors.
[pic of repetier host heatmap]
These items are independent and need to be fixed or corrected for in different ways. The physically leveling the bed will set it normal the printer, but it cannot the bend I am experiencing. I then moved to excel to plot the results in 3D. I grabbed the output log from the printer and manually rearranged the data into a table.
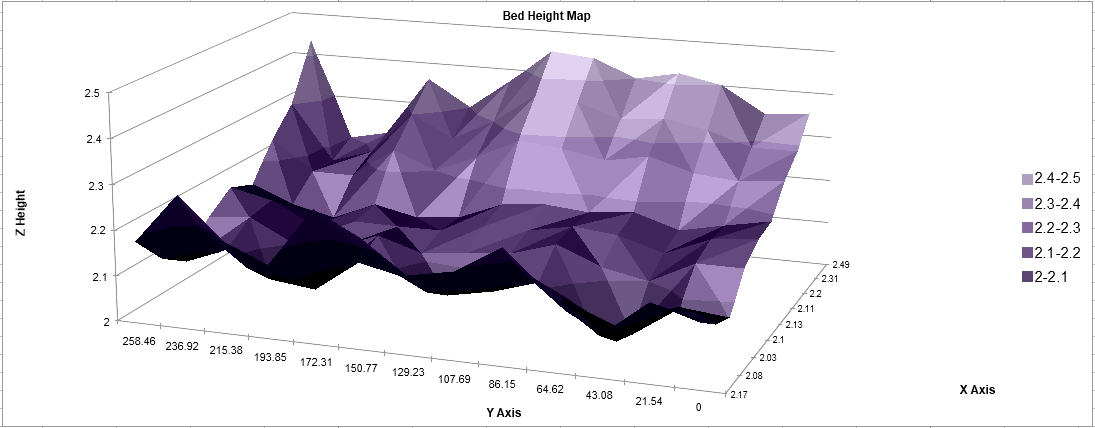
Mesh of the first data taken with the z-probe. The bend is clearly seen along the x-axis.
This worked nicely, but took a lot of time to move the numbers into the correct spot. After adjusting and checking a few times I had enough and set out to automate the process in R, because I knew it would have a multitude of options to produce pretty 3D graphs, and perhaps even interactive ones!
After using Repetier-Host to command the printer to probe a grid, the log would look like this.
After using Repetier-Host to command the printer to probe a grid, the log would look like this.
|
I parsed out the important lines with the Z-probe data and ignored the temperature and location status updates. Out of maybe 10,000 lines of logged data there are only 126 data points I'm collecting, in my 9x14 grid. After wrangling the data types I arrange it into a tidy format.
| X | Y | Z | |
|---|---|---|---|
| 1 | 2.0 | 0.0 | -3.169 |
| 2 | 30.3 | 0.0 | -3.126 |
| 3 | 58.6 | 0.0 | -3.136 |
| 4 | 86.9 | 0.0 | -3.122 |
| 5 | 2.0 | 22.5 | -3.238 |
Mimicking the 3D chart from Excel is trivial, but I wanted to be able to move around and examine the data from any perspective to better see trends and issues. Using the plot3D package, extended with the plot3Drgl package, I built a fully interactive 3D window. In these charts the Z-axis is expanded 20x to better show the variation. I am interested in 0.1mm variation across a 200x280 plane so any issues are otherwise invisible.
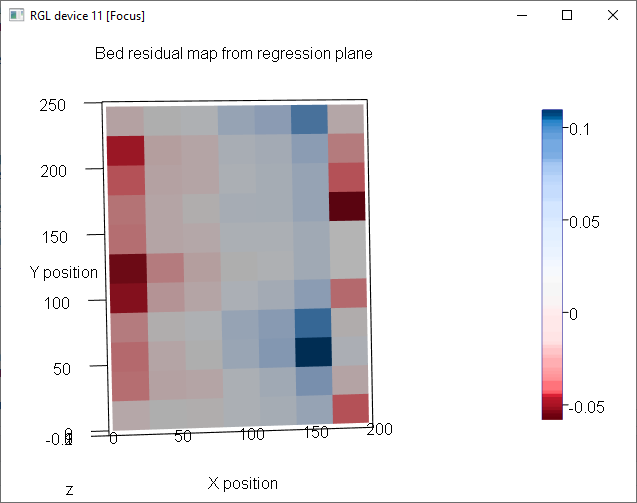
This is pretty cool, but it still shows me the combined error of non-normal and non-planer. To see the bumps and bends I calculated a best fit regression plate for the data, representing the theoretical angle of 'perfectly flat' bed. You can clearly see the X axis is sinusoidal and there are localized bumps distributed along the Y axis.
I tried in vain to bend the 3mm aluminum plate back to shape, but ended up replacing it with borosilicate glass. This brought the flatness to within XXXmm. I enabled Z-axis planar compensation (with the probe measuring each time) to cover up that the bed will always be slightly out of normal with the machine. Adhesion problems finally solved! Below is the final data I took for comparison to the original build plate.
This is a plot of the residuals between the data and the regression plane (a heat map with just what I want to see) for the final build plate. The maximum variation across the whole plate is now just 0.15mm. For any print less than 150mm in X the variation is even less, because most of the divots are on the edge.